← Back to rubinobservatory.org

Catalog Simulator (CatSim)

The number counts of galaxies in the simulated catalog compared to observational data (i band)

The catalog simulation framework (CatSim) comprises a database of stars, galaxies, and Solar System objects that can be queried as a function of position and survey time. These simulations incorporate variability for a subset of the stellar sources and for the AGN in the galaxy catalog.

Galaxies

We describe here the properties of the initial galaxy database that is stored within the CatSim framework. A more recent galaxy catalog (CosmoDC2) has been constructed as part of the Dark Energy Science Collaboration data challenges. This new cosmological catalog is derived from N-body simulations coupled to the Galacticus semi-analytic model. It covers > 400 deg2 of the sky and reaches a redshift limit of z=3 and a magnitude limit of r=28. Full details of this catalog are available in the following article. We recommend the adoption of this catalog for cosmological tests for LSST simulations. For completeness we describe below the properties of the initial cosmological catalog in CatSim 

These initial CatSim galaxy simulation is based on dark matter haloes from the Millennium and a semi-analytic baryon model described in De Lucia et al. The semi-analytic model features radiative cooling, star formation, the dynamics of black holes, supernovae, and AGNs and was adjusted to mimic the luminosity, color, and morphology distributions of low redshift galaxies.  LSST cosmological catalogs were generated from the De Lucia et al. data by constructing a lightcone, covering redshifts 0<z<6 from 58 500 h−1 Mpc simulation snapshots. The final catalog comprises a 4.5x4.5 degree footprint on the sky (sufficient to cover a single LSST field-of-view) and samples halo masses over the range 2.5x10⁹ to 1012 M¤

Dynamically tiling this footprint across the sky enables the simulation of the full LSST survey area while keeping the underlying data volume small (but at the expense of introducing periodicity in the large scale structure). For all sources, a spectral energy distribution (SED), is fit to the galaxy colors using Bruzual and Charlot spectral synthesis models. The De Lucia et al. catalog includes BVRIK magnitudes and dust values for the disk and bulge components of each galaxy as well as radii, redshift, coordinates, stellar age, masses and metallicities. Fits are undertaken independently for the bulge and disk and include inclination dependent reddening. Morphologies are modeled using two Sersic profiles and a single point source (for the AGN). Bulge-to-disk ratios and disk scale lengths are taken from De Lucia et al. Half-light radii for bulges are derived from the absolute-magnitude vs half-light radius relation given by Gonzalez et al. Colors and stellar mass of the AGN host galaxies are estimated from the AGN luminosities. 

Galactic Structure

Stars are represented as point sources and are drawn from the Galfast model of Juric et al. Galfast generates stars according to density laws derived from fitting SDSS data to a model of a thick and thin disk, and a halo. Each star is assigned a metallicity, proper motion, and parallax. Spectral energy distributions are fit to the predicted colors using the models of Kurucz for main sequence stars and giants, Bergeron et al. for white dwarfs, and a combination of spectral models and SDSS spectra for M, L, and T dwarfs. For Galactic reddening, a value of E(B-V) is assigned to each star using the three-dimensional Galactic model from Amores and Lepine. For consistency with extragalactic observations, this reddening model is re-normalized to match the values in the Schlegel et al. dust maps at a fiducial distance of 100 kpc.

Approximately 10% of the stellar sources are variable at a level detectable by LSST. Variability is modeled by defining a light curve, its amplitude, a period, and a phase. For queries that contain time constraints, the magnitude of the source is adjusted based on the properties of the light curve (the current implementation only allows for monochromatic variations in the fluxes). Current variability models include cataclysmic variables, flaring M-dwarfs, and RR Lyrae. For transient sources, the period of the light curve is set to >10 years such that the sources will not repeat within the period of the LSST observations. For stars that have not been assigned a definite variability class, we model variability by assigning light curves taken from the Kepler Q17 data release.  Since storing the roughly 200,000 light curves for use with our simulations software stack would have proven burdensome, we used an iterative Lomb-Scargle algorithm to decompose each light curve into 51 Fourier components.  We stored the frequencies, amplitudes, and phase offsets associated with these Fourier components for use in reconstituting the light curves when needed.  We assigned Kepler light curves to the stars in our simulated Milky Way by taking the quiescent properties of the Kepler sources from the Kepler Input Catalog (Brown et al., 2011) and associating each simulated star with its nearest Kepler neighbor in (g-r), r color-magnitude space. For transient sources, the period of the light curve is set to >10 years such that the sources will not repeat within the period of the LSST observations.

Solar System

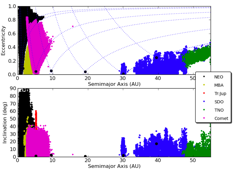
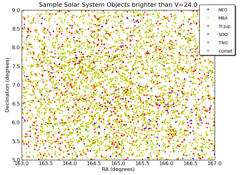
The Solar System model is a realization of the Grav et al. model. All major groups of Solar System bodies are represented including: main belt asteroids, near earth objects, trojans of the major planets, trans-neptunian objects, and comets. There are approximately 11 million objects in the Solar System catalog with the vast majority (about 9 million) being main belt asteroids. Populations are complete down to apparent magnitudes of V=24.5 and each object is assigned a carbonaceous or stony composition spectrum. The choice of a C or S type spectra for an object is based upon a simple relation to the size of its orbit that approximately matches SDSS asteroid observations. The location of the Earth at the time of a particular observation is incorporated through the orbital ephemeris software oorb. 

An example of output catalogs from the catalog are available
  • As an example of an input file to the photon simulator (phosim)
  • As an example of an input file to the image simulator (imsim)
  • The FITS generated by these catalogs are here (phosim) and here (galsim)
 
A more detailed description of Catsim is available
  • Installation of the catalog framework and tutorials for how to generate catalogs are available here
  • The parameters (schema) stored within the database are described here
  • The codebase for the catalog simulations are accessible through Github

For more details of CatSim or if you have questions, they can be addressed using community.lsst.org.

Additional Image Captions: 

Fig. 2 - The distribution of stars within the Galaxy model.

Fig. 3 & 4 - The distribution of asteroid populations within catsim and a realization of the positions of these asteroids on the sky.

Financial support for Rubin Observatory comes from the National Science Foundation (NSF) through Cooperative Agreement No. 1258333, the Department of Energy (DOE) Office of Science under Contract No. DE-AC02-76SF00515, and private funding raised by the LSST Corporation. The NSF-funded Rubin Observatory Project Office for construction was established as an operating center under management of the Association of Universities for Research in Astronomy (AURA).  The DOE-funded effort to build the Rubin Observatory LSST Camera (LSSTCam) is managed by the SLAC National Accelerator Laboratory (SLAC).
The National Science Foundation (NSF) is an independent federal agency created by Congress in 1950 to promote the progress of science. NSF supports basic research and people to create knowledge that transforms the future.
NSF and DOE will continue to support Rubin Observatory in its Operations phase. They will also provide support for scientific research with LSST data.   


Contact   |   We are Hiring

Admin Login

Back to Top