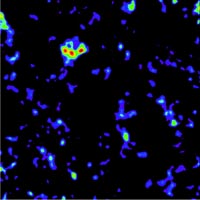
A glimpse of a universe of mass. Shown here is a map of mass obtained by gravitational lens mass tomography. This 2x2 degree field of mass, obtained in 15 hours of 4-meter telescope exposures in the Deep Lens Survey, would fit easily inside LSST's single snapshot field of view.
LSST will find hundreds of thousands of these massive clusters in a stunning 3-D view of the universe of mass extending over 20,000 square degrees of sky and back to half the age of the universe. Sharp constraints on cosmology and the physics of dark energy will result.
(Wittman et al. 2003 ApJ 579, 218)
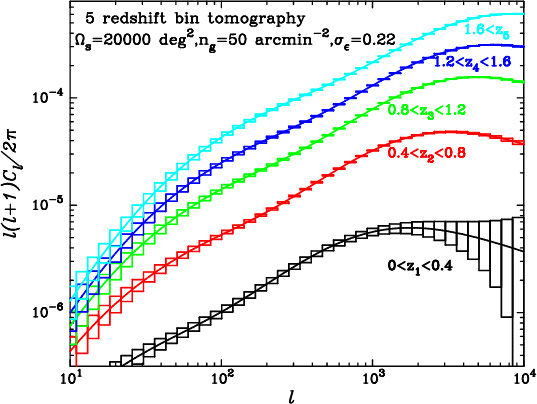
In shear-shear tomography, the shear of background galaxies, binned in redshift, is cross correlated. There are tens of such co-spectra. These are quantities that can be measured as a function of cosmic time using photometric redshifts. Combining these results with those from the CMB allows constraints on the physics of dark energy (Hu & Keeton 2002). Adding cross-correlations with foreground galaxies increases the precision significantly (Hu & Jain 2004). The resulting tens of shear cross correlations vs redshift are very powerful independent probes of the expansion history (see Figure 1). When combined with cosmic microwave background data (see below), these measurements sharply constrain the nature of dark energy.
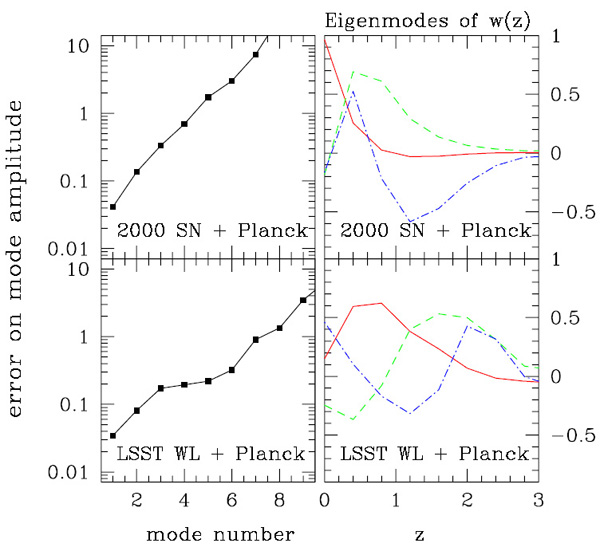
It is clear that the unparalleled survey area of LSST allows a significant detection of the shear power spectra over a wide range of angular scales, from degree scales to arcminute scales. The source redshift dependence of the power spectra is very sensitive to cosmological parameters including the equation of state parameters of dark energy. Using the shear power spectra together with Planck data, LSST will usefully constrain six eigenmodes of the dark energy equation of state (see Figure 2). There is a striking difference in the modes for Type 1a supernovae vs. the modes for LSST weak lensing: Those for LSST stretch out to higher z. The reason for this is that lensing is less sensitive to the growth factor at the lower redshifts where the source density in a given redshift bin is small and the lensing window (for sources at higher z) is also small. Thus the supernovae are better at detecting changes in w(z) at lower z and LSST shear tends to be better at detecting changes at higher redshift. LSST and planned supernova surveys also have strikingly different eigenvalue spectra. The error on the amplitude of the best determined mode is quite similar for each ~0.03. But for the supernova surveys, the spectrum is much steeper. LSST has seven modes with errors smaller than unity, whereas the supernova survey has four.
Figure 1: The lensing shear power spectra constructed from 5 redshift bins. Only the 5 auto-power spectra of each redshift bin among the available 15 spectra are displayed, and the solid curves show the predictions for the concordance ΛCDM model. The boxes show the expected 1σ measurement error due to the sample variance and intrinsic ellipticities (the sample variance is dominant at about l<1000, while the intrinsic ellipticities are dominant at l>1000).
Figure 2: Eigenvalues and first three eigenmodes of the w(z) error covariance matrix for LSST WL+Planck and JDEM 2000 SNe+Planck. The best-determined mode for each dataset has a standard deviation of about 0.03. This error rises quite slowly with increasing eigenmode number for the lensing data, reaching one only by the 7th mode. The eigenmode shape differences indicate that lensing is better at probing higher z while supernovae have their chief advantage at lower z.
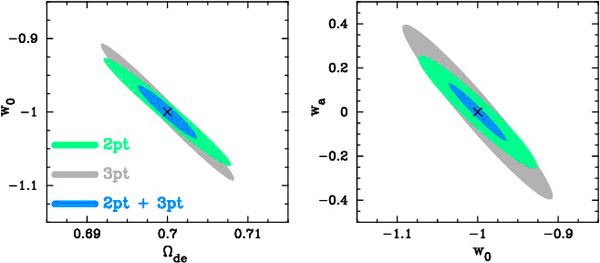
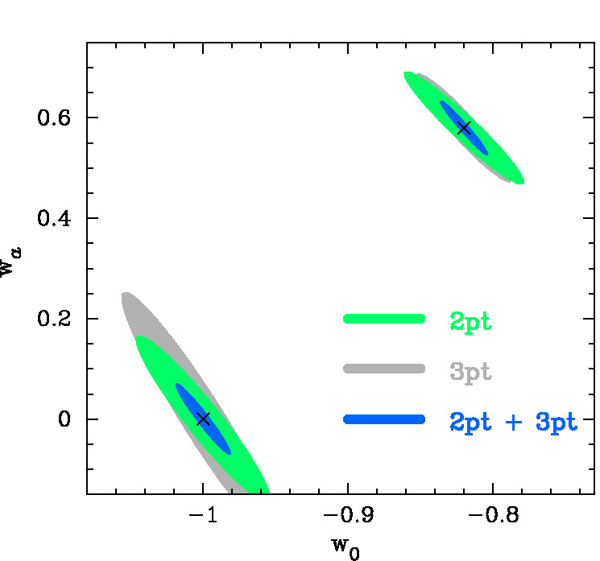
Cosmic density fluctuations are starkly non-Gaussian on small scales at lower redshift, so there is information present beyond the power spectrum. Research is in progress to see how much cosmological information can be extracted from higher-order behavior: bispectrum (three-point correlations), trispectrum (four-point correlations), etc. For all these data analysis techniques a large number of source galaxies and coverage of a significant fraction of the sky are crucial. For large numbers of source galaxies, three-point correlations of shear vs redshift become feasible. Takada & Jain (2003) show that the bispectrum information from an LSST-scale survey is as powerful as the power spectrum in constraining dark energy parameters. Curiously, the resulting constraints on dark energy are independent of those from the other WL analyses and are subject to somewhat different systematic errors. Large data sets, such as only LSST could produce, are required. The expected errors with LSST are shown in Figure 3 (without CMB) and in Figure 4 (with CMB).
Figure 3 68% C.L. constraints in two parameter space for the dark energy density parameter Ωde and its equation of state parameters given by w(a)=w0+wa(1-a). The ΛCDM model is assumed for the fiducial, angular models of 50<l<3000, and 7 cosmological parameters in the Fisher matrix. No CMB priors. The green, gray and blue contours show the constraints expected from the power spectrum tomography, the bispectrum tomography and the joint tomography of combining the two.
Figure 4 Similar to Figure 3 except that Planck priors were used. It is clear that the bispectrum tomography improves parameter constraints by a factor of 2 compared to just power spectrum tomography, reflecting that the non-Gaussian signal in weak lensing provides additional cosmological information that cannot be extracted by the power spectrum. (Hu 2002; Takada & Jain 2004; Song & Knox 2004).
Weak lensing measurements on small scales are limited by the noise from the intrinsic ellipticities of the background galaxies. To average down this shot noise one wants deep images to maximize the number of resolved galaxies per unit area on the sky. On larger scales, one is limited by cosmic variance; we therefore need to maximize the sky coverage of the survey. A very deep survey of a significant fraction of the visible sky in enough wavelength bands to allow photometric redshifts, will enable multiple cosmological tests to be carried out. No other existing or planned observatory would be capable of such a survey.
Shear from foreground sources as a function of redshift ("shear cosmography"). WL shear due to known foreground structures as a function of the redshift of the background sources (as determined from photometric redshifts) allows a measurement of the redshift-distance relation, which depends on the cosmological model (Bernstein & Jain 2003). This method differs from the shear power spectrum in that it does not attempt to characterize the statistics of the mass distribution of lenses, but focuses merely on measuring relative cosmological distances. Extreme precision in color-redshifts is required however.
Is the acceleration of the universe due to new physics in the stress-energy of the universe (the "dark energy") as commonly assumed, or is it due to new gravitational physics? We know of dark energy only through its gravitational effects. We must be open to the possibility that there is no additional diffuse component in the stress-energy, and that the observed acceleration will only be correctly understood once we have a deeper theory of gravitation. Cosmic shear data provide us with an opportunity to discriminate between these very different explanations for acceleration. This ability is due to the sensitivity of cosmic shear data not just to the history of the expansion rate, H(z), but also to the rate of growth of the large-scale density field. Cosmic shear depends on the mass density field as a function of redshift, since the density field is what does the lensing of background galaxies, and it depends on the history of the expansion rate, since that determines the distance-redshift relation and therefore how length scales at a given redshift project into angular separations on the sky today.
In linear perturbation theory, the growth of structure can be very simply described. The time and space dependence factorize so that the density contrast at location x at time t is δ(t,x) = g(t) δ(t0,x) where t0 is the current epoch and g(t) is called the growth factor, often written as a function of redshift, g(z). This growth factor depends on the gravitational force law.
One can model the observed cosmic shear power spectra as a function of redshift by varying both g(z) and the distance-redshift relation, D(z), as independent functions. The cosmic shear power spectra are capable of constraining both separately with the same data (Song 2005). This ability allows for a very important test. In Einstein gravity with dark energy, these two functions are not independent. With the dark energy properties adjusted to give the observed D(z), a prediction can be made for g(z). Theories of gravity with modified force laws on Mpc and larger scales will generally have different predictions for g(z).
The requirements for detection of these possible departures from Einstein gravity are model-dependent. Our best bet for seeing such a signature, and cleanly identifying it as such, will be to cover as large an amount of sky as possible in a deep weak lens cosmic shear survey with photometric redshifts. A deep wide-angle survey of cosmic shear covering tens of thousands of square degrees, combined with photometric redshifts and shapes of billions of source galaxies, will be required. This survey requires the wide-deep precision shear observations unique to LSST. Multiple weak lens shear tests and supernova data, when combined, will add further diagnostics. For a single source redshift, the changes in the shear power spectrum due to a change in r(z) at just one redshift, could also come from the appropriately chosen changes to g(z) over a range in redshifts. Thus it is impossible to simultaneously reconstruct g(z) and r(z) from the shear power spectrum of a single source redshift bin. Including multiple source redshift bins breaks this degeneracy.
Suppose we have 8 redshift bins. In order to understand how the degeneracy is broken with multiple source redshifts, it is instructive to first consider the (unphysical) case of a matter power spectrum that is a perfect power law. In this case the shear power spectra will be power laws as well. Changing r(z) and g(z) will not change the shape of any shear power spectrum, only its amplitude. Therefore the eight auto power spectra can only be used to determine eight numbers, not sixteen and the degeneracy remains.
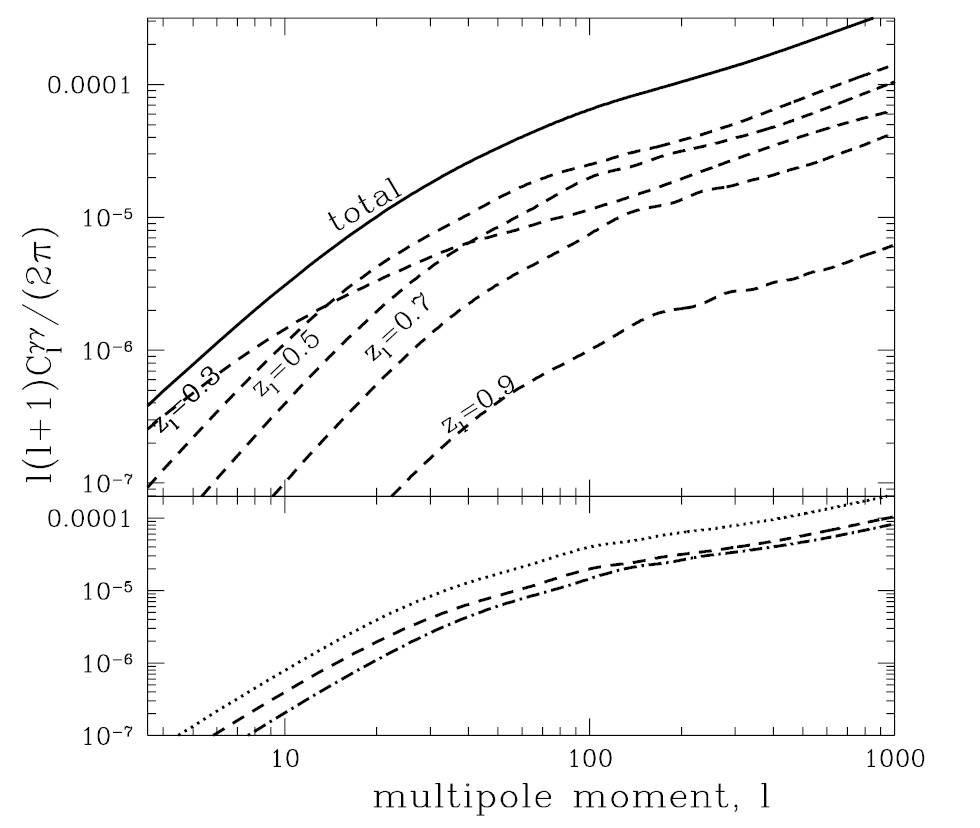
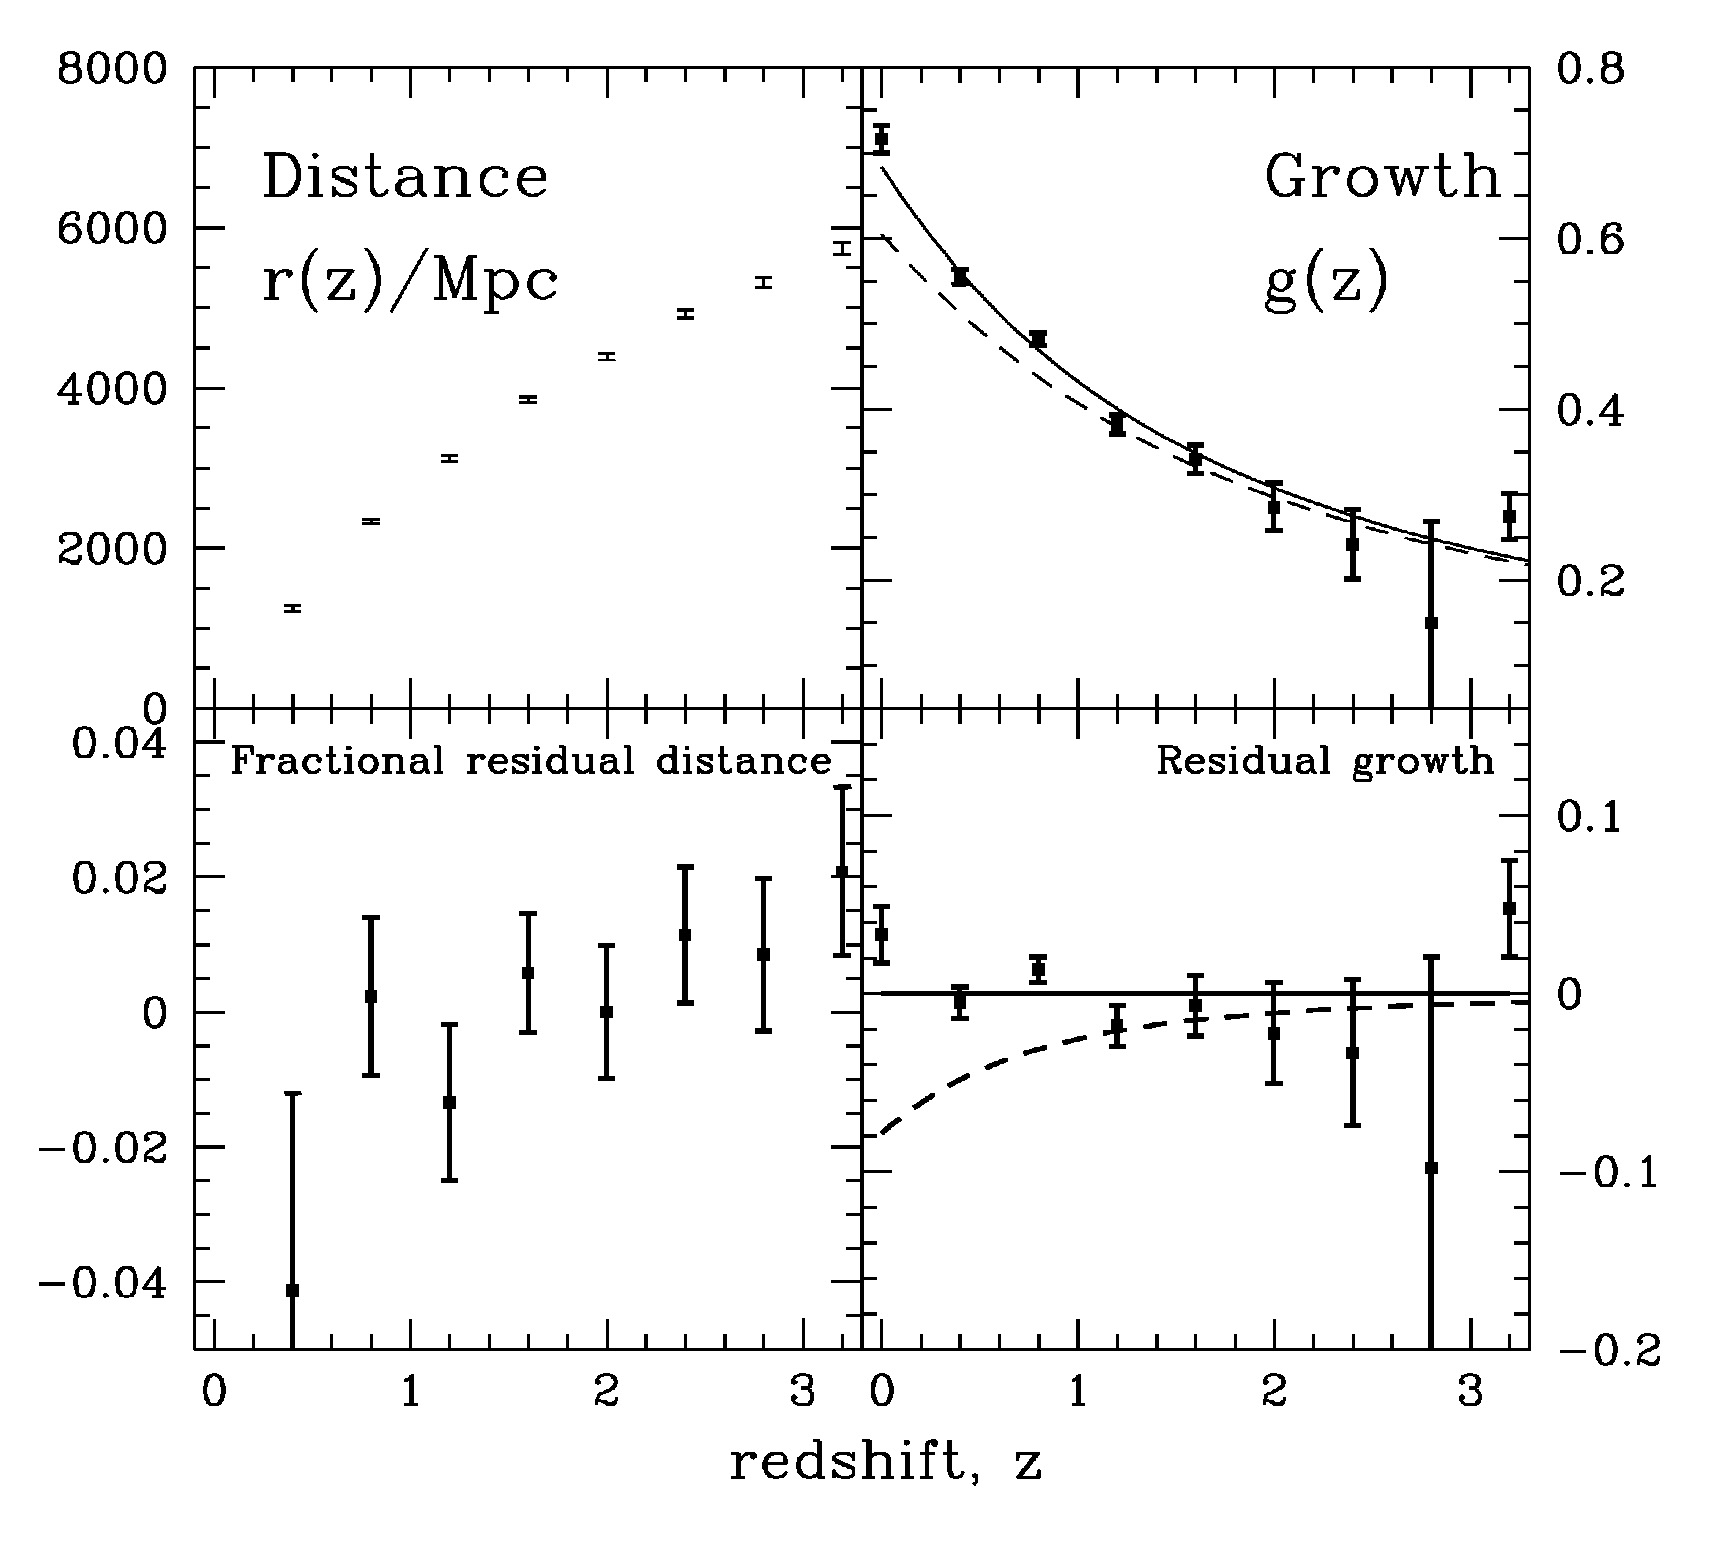
This would-be degeneracy is broken in two ways. First, the matter power spectrum at each redshift is not actually a power law. It has a scale imprinted upon it; the size of the horizon at the epoch when matter density equaled radiation density. One can see this scale showing up as a bend in the total shear power spectrum at l ~100 in Figure 5, dependence of the z=1 shear auto power spectrum on g(z) and r(z). Further departures from a power law are caused by non-linear evolution; due to non-linear effects, changing g(z) does change the shape of the matter power spectrum at z and therefore the shear power spectra. Second, and far more importantly, in addition to the eight auto power spectra there are 28 cross power spectra. These 36 amplitudes in total are sufficient for reconstructing eight r(z), nine g(z) and, as well as the 8 shear calibration parameters (see Figure 6).
Figure 5 Dependence of the z=1 shear auto power spectrum on g(z) and r(z). For n redshift bins there are n-1 additional auto power spectra and n(n-1)/2 cross power spectra, which are not shown here. The solid line is the shear power spectrum for sources at z=1. The dashed lines show the contributions to this shear power spectrum from lens slices of width Δz=0.2 centered at z = 0.1, 0.3, 0.5, 0.7 and 0.9. Their sum gives the solid line. The lower panel shows the z=0.5 contribution again (dashed line), how it would look with an increase in g(z=0.5) (dotted line) and how it would look with an increase in r(z=0.5) (dot-dashed line).
Figure 6 Measuring geometry and growth. Reconstructed distances (left panel), and growth factors (right panel). Bottom panels show [r(z)-rfid(z)]/rfid(z) where r(z) are the reconstructed distances and rfid(z) are the distances in the fiducial model, and the corresponding residual growth. The curves in the right panels are the growth factor for the fiducial DGP model (solid) and the growth factor for the Einstein gravity model (dashed) with the same H(z) as the DGP model.
There is historical precedent for phenomena that can be explained with new unseen forms of matter actually having their true explanation in a new theory of gravity. The anomalous perihelion precession of Mercury detected in the 19th century was first explained with unseen matter (Leverrier 1860). Of course we now know this anomalous precession is due to relativistic corrections to Newtonian gravity.
Cosmic shear data provide us with an opportunity to discriminate between two very different explanations for acceleration. This ability is due to the sensitivity of cosmic shear data not just to the history of the Hubble expansion rate, but also to the rate of growth of the large-scale density field. In effect, we have two windows on the mechanism driving acceleration. By measuring shear on large scales, LSST is uniquely capable of separating geometry effects and growth of mass structure.