← Back to rubinobservatory.org

Visualization, Analysis & Reporting

Once a simulated survey is planned, designed and executed, it is useful to evaluate whether that particular survey met the LSST project science goals. Quantifying how well a simulated survey achieves a science objective or whether one simulation is "better than" another is a complex and open-ended problem.

A software tool has been created which executes a series of queries on the simulated survey history and creates a printable standard report that contains statistics, distributions, and sky maps designed to characterize the survey. This set of analyses is by no means comprehensive because of the broad range of science the survey enables.

The standard report is a useful initial characterization of a simulated survey and contains analyses which compare to the design and stretch specifications from the SRD. To more fully assess how well a survey meets a particular science goal, the development of a variety of scientific figures of merit is needed. Also, the process of making sense of the data requires the ability to explore and analyze it in an interactive way, and to communicate and collaborate about the results.

To this end we are

  • Working with Science Collaborations to develop figures of merit.
  • Designing an efficient and extensible framework for the figures of merit.
  • Enabling comparisons between simulated surveys.
  • Using visualization software for fast analysis and rapid prototyping.
  • Working with the ASCOT Team at the University of Washington to explore the feasibility of creating our own interactive analysis tools.

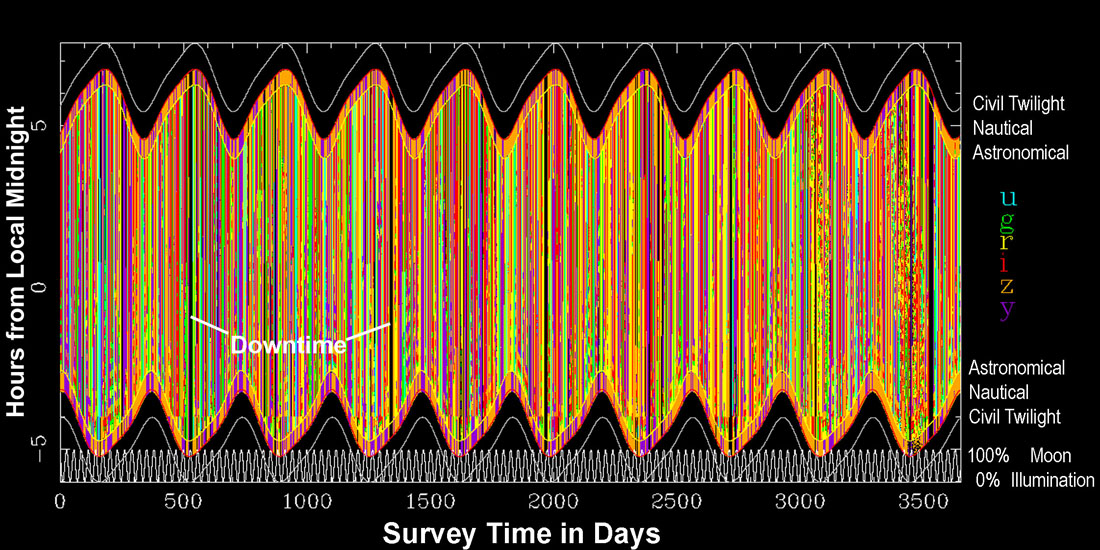
Here is an example of a diagnostic plot produced in the standard report.

An inventory of the time spent observing during the night color-coded by filter for a 10-year survey. The enclosing curves indicate the time of civil (−6°), nautical (−12°), and astronomical (−18°) twilight. Note that only z- and y-filters are used between astronomical and nautical twilight. The Moon’s illumination (in percent) is indicated by the arbitrarily scaled white curve at the bottom of the plot.

Financial support for Rubin Observatory comes from the National Science Foundation (NSF) through Cooperative Agreement No. 1258333, the Department of Energy (DOE) Office of Science under Contract No. DE-AC02-76SF00515, and private funding raised by the LSST Corporation. The NSF-funded Rubin Observatory Project Office for construction was established as an operating center under management of the Association of Universities for Research in Astronomy (AURA).  The DOE-funded effort to build the Rubin Observatory LSST Camera (LSSTCam) is managed by the SLAC National Accelerator Laboratory (SLAC).
The National Science Foundation (NSF) is an independent federal agency created by Congress in 1950 to promote the progress of science. NSF supports basic research and people to create knowledge that transforms the future.
NSF and DOE will continue to support Rubin Observatory in its Operations phase. They will also provide support for scientific research with LSST data.   


Contact   |   We are Hiring

Admin Login

Back to Top